
Two small solar inverters on the balcony, and one question: how much of this do we actually use?
The inverters
Nothing special here. I bought two Hoymiles micro inverters (HM-300 and HM-400, 700 W together), simply because they were cheap. The interesting part is getting the numbers out of them. Locally, every few seconds, and without the manufacturer’s cloud.
For Hoymiles I use AhoyDTU, an open-source firmware for an ESP microcontroller with a cheap radio module that talks to the inverters directly. Power, voltage, current, temperature and the yield per inverter end up on MQTT. It also supports Home Assistant MQTT discovery, so most home automation systems pick up the values without typing a single topic. OpenDTU is an alternative that does the same job.
Different inverters? Then neither of them will help you, but there are other ways:
- Many inverters have a local interface, like Modbus TCP or a small HTTP API.
- A smart plug with power metering between inverter and socket works with every balcony inverter. You lose the details per panel, but you still get the power and the energy per day. And that is what counts.
Is the DTU still alive?
The DTU registers an MQTT last will. When it disappears from the network, the broker publishes not connected in its name. If that lasts five minutes, I get a push notification on my phone.
Of course I had to test it, so I unplugged the DTU:
23:06:30  InverterAhoyConnection  connected -> not connected   (last will)
23:11:30  InverterAhoyOffline     OFF -> ON                    (alarm, push notification)
23:12:42  InverterAhoyConnection  not connected -> connected   (plugged in again)
23:12:42  InverterAhoyOffline     ON -> OFF                    ("back online" notification)
Works. Why not simply raise an alarm when the inverters stop sending? Because they do that every evening. No sun, no inverter. The DTU stays connected all night, so it is the better signal.
The other side: the grid
The panels are only half of the story. To know how much of their energy the house uses, I need the grid side too. A Shelly 3EM in the distribution board measures the net power over all three phases. Positive means import, negative means export.
With these two values I get everything else:
- Export: what went back to the grid
- Self-used PV: production minus export (per hour, never below zero)
- Consumption: grid import plus self-used PV
The numbers
From 1 January to 7 October 2026:
| kWh | |
|---|---|
| PV production | 663 |
| used in the house | 459 |
| exported | 209 |
| house consumption | 2,885 |
| grid import | 2,426 |
So about two thirds (69%) of the solar energy is used in the house, and the 700 W cover 16% of our consumption. Not much, but not nothing either. The best day so far was 8 April 2026 with 4.1 kWh, and since September 2023 the two inverters have produced 1,631 kWh in total.
What bugs me are the 209 kWh of export. I get no feed-in compensation, so this energy is simply given away. That is 0.75 kWh per day on average, and a lot more on sunny summer days. Every kWh I use myself saves the full electricity price.
Here is 8 October in Grafana:
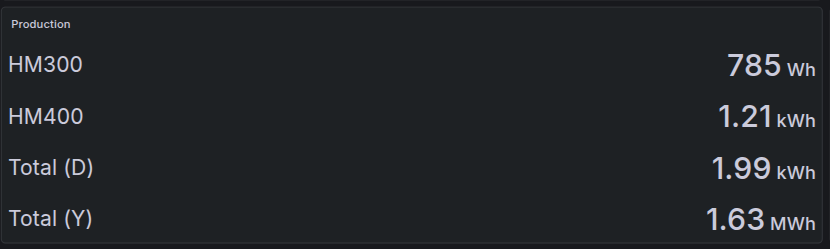
Total (D) is today, both inverters together. Total (Y) is not the year, it is everything since the start, the 1,631 kWh from above.